

Emissions, and Emission Changes From Existing Vehicles using Ethanol Blends
And some more data on mileage changes
Road testing of vehicles inevitably involves both factors, but we will stress emissions in this discussion.
1. Oak Ridge National Laboratory Tests
1.1. Existing vehicles using Ethanol Blends Higher than E10
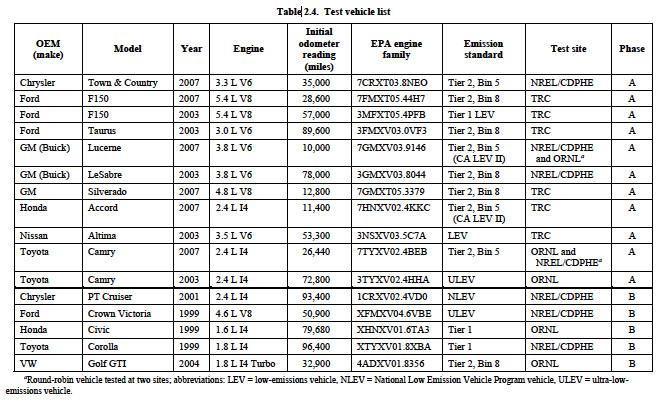
Knoll et al 2009 in "Effects of Intermediate Ethanol Blends on Legacy Vehicles and Small Non-Road Engines, Report 1 – Updated" from Oak Ridge National Labs did extensive tests on 16 commonly used vehicles.
For this analysis, the vehicles were treated as being selected at random from the population of late model vehicles (model years 2000 to 2007) that were on the road in early 2007. Although the tested vehicles were not selected at random, they are representative of this population in that the numbers of tested vehicles are nearly proportional to the population counts for each manufacturer, engine size category (number of cylinders), and emissions standard period (Transitional Tier 2: 2000 through 2004 or Tier 2: 2005 through 2007).
Vehicles tested were:
They summarize the tests:
The following regulated tailpipe emissions showed no discernable trend with increasing ethanol content.
• Oxides of nitrogen (NOX) and non-methane organic gases (NMOG) showed no statistically significant trend with fuel type.
The following trends from E0 to E20 were found to be statistically significant.
• Carbon monoxide emissions declined with E20 (12% on average) when compared to E0. This result was statistically significant, and similar reductions were found with E10 and E15 (15% on average for each).
• Non-methane hydrocarbons (NMHC) decreased with E20 (15% on average) when compared to E0. This result was statistically significant, and similar reductions were found with E10 and E15 (12% and 11% on average, respectively).
• Fuel economy decreased (7.7% on average), consistent with the energy density reduction associated with ethanol blending (in limited tests, this trend was observed to continue to E30).
• Ethanol emissions increased with E20 from zero by an average 8.2 mg/mi. Increases for E10 and E15 were 5.6 mg/mi and 6.8 mg/mi, respectively.
• Acetaldehyde emissions increased with E20 by an average of 0.81 mg/mi from an average of 0.35 mg/mi for E0. Increases for E10 and E15 were 0.38 mg/mi and 0.70 mg/mi, respectively.
• Formaldehyde emissions increased with E20 by an average of 0.11 mg/mi from an average of 0.71 mg/mi for E0. Increases for E10 and E15 were 0.11 mg/mi and 0.14 mg/mi, respectively.
With respect to Exhaust and Catalyst Temperature Effects:
The following observations were made based on measurements of exhaust fuel:air ratio and temperatures of the exhaust system and catalyst with E0 and E20.
• Seven vehicles ran leaner with E20 than with E0 fuel, but still rich, at wide open throttle. The change in fuel:air equivalence ratio roughly corresponded to the oxygen content of the fuel.
• For vehicles that ran leaner on E20, peak catalyst temperatures were found to increase by 29° to 35°C during WOT accelerations when compared to operation on E0.
• For vehicles that did not run leaner on E20, peak catalyst temperatures were slightly cooler on average but largely unchanged during WOT accelerations when compared to operation on E0.
• During closed-loop (stoichiometric) operation, exhaust and catalyst temperatures were slightly cooler on average but largely unchanged with increased ethanol content on all vehicles tested.
1.2. Unforeseen Operational Issues
• No driveability or operability issues were observed for the 16 vehicles tested in this pilot study.
1.3. Emissions from ethanol blends
Table 3.1 shows the average changes in regulated emissions, fuel economy, and selected aldehyde emissions with E10, E15, and E20, relative to E0. Results are presented for fuel economy as well as the regulated emissions [non-methane organic gas (NMOG), CO, NOX, and formaldehyde] and NMHC, ethanol, and acetaldehyde, which constitute the majority of NMOG emissions. The average relative changes were obtained by determining the relative change (from E0 to E20, for example) in average emissions measurements for each vehicle, then calculating the average and confidence limits using the data from all 16 test vehicles. Changes in ethanol, acetaldehyde, and formaldehyde emissions are presented in milligrams per mile, while other emissions changes are presented as percent change relative to E0. The gray areas are considered statistically significant results.
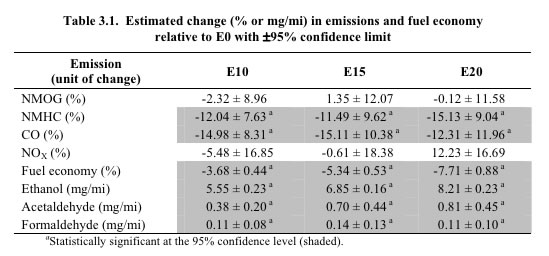
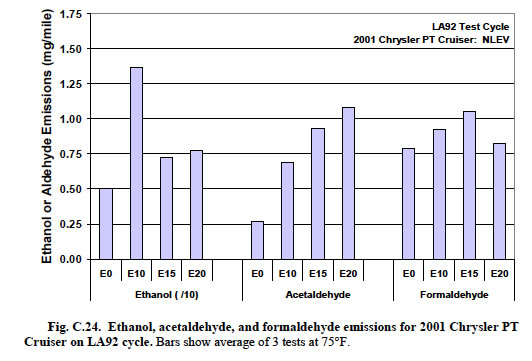
As we can see, 1) the CO NMHC decreased 12.5-15%. There is no statistical evidence that NMOG or NOX emissions were affected by ethanol content. The formaldehyde increase to 110 micrograms/mi at E10, to 140 @ E15, and then down to 110 at E20 is interesting, since E10 formaldehyde emissions currently receive an EPA waiver. The increases in Acetaldehyde also need to be addressed in more detail later. We will look at both are they harmful levels, and second what exhaust modification are needed to eliminate them.
1.3.1. Averaged Emissions
As ethanol percentage in a blend increases, as we will show, also all emissions decrease, with the exception of the aldehydes, formaldehyde. It has generally been thought that the most dangerous aldehyde resulting from burning alcohol is formaldehyde. But as we will see below, blends of E15 and E20 in many cases result in less formaldehyde.
1.3.1.1 Formaldehyde
John M. E. Storey, Teresa L. Barone, Kevin M. Norman, and Samuel A. Lewis, Sr. 2010, Oak Ridge National Laboratory report on key emissions in "Ethanol Blend Effects On Direct Injection Spark-Ignition Gasoline Vehicle Particulate Matter Emissions", Formaldehyde is an unregulated emission that is more reactive in te atmosphere than ethanol. Average values from the ORNL vehicles tests for the aldehydes are shown below. Clearly formaldehyde decreases by going to E10, and remains at that level at E20.
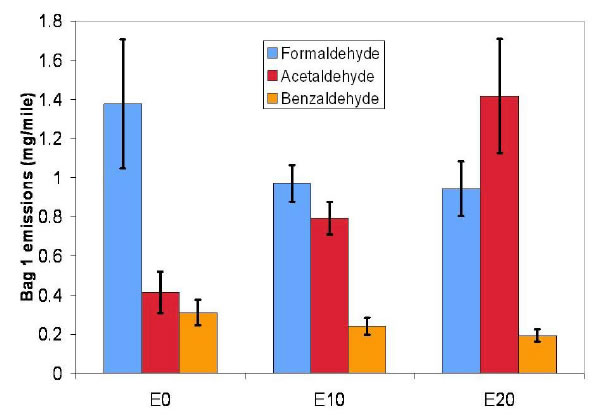
1.3.1.2. Acetaldehyde emissions
One area where there is a persistent increase as shown is the chart above, is in Acetaldehyde. The reaction of acetaldehyde with the OH free radical in urban atmospheres leads directly to the formation of the peroxyacetal radical, which can react with NO2 to for PANs (Peroxyacyl nitrates). PANs are both toxic and irritating, as they dissolve more readily in water than ozone. They are lachrymators, causing eye irritation at concentrations of only a few parts per billion. At higher concentrations they cause extensive damage to vegetation. Both PANs and their chlorinated derivates are said to be mutagenic, as they can be a factor causing skin cancer. PANs are secondary pollutants, which means they are not directly emitted as exhaust from power plants or internal combustion engines, but they are formed from other pollutants by chemical reactions in the atmosphere. Free radical reactions catalyzed by ultraviolet light from the sun oxidize unburned hydrocarbons to aldehydes, ketones, and dicarbonyl compounds, whose secondary reactions create peroxyacyl radicals, which combine with nitrogen dioxide to form peroxyacyl nitrates.
1.3.1.3. Particulate emissions (PM)
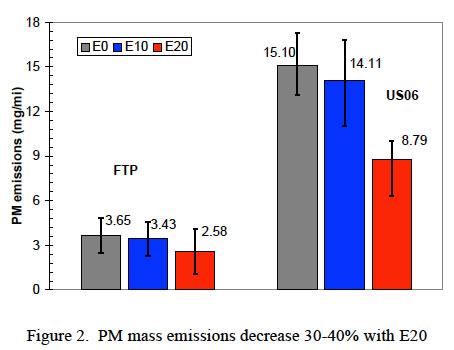
The more aggressive US06 cycle (on the left) not only had much higher PM emissions for all three fuels, but also a bigger decline in emissions with E20. The E20 results showed a 42% decrease relative to the E0 average. Overall, the cycle-based PM mass emissions are similar to pre-2002, in-use, port fuel injection low-emission vehicles (LEVs) for which an average of 4 mg/mile PM levels was observed.The size distribution of particles from E0, E10 and E20 at 30 mph and 80 mph are shown.
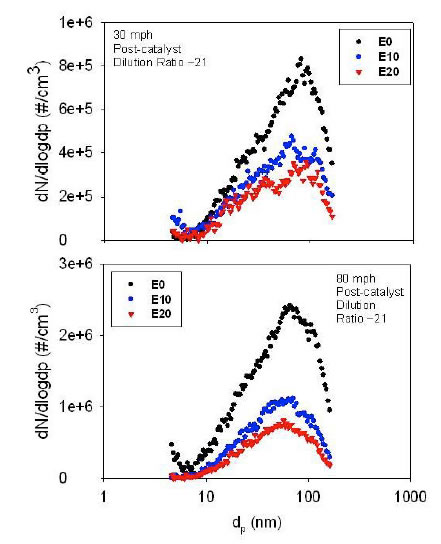
Since these particulates are so small that they don't get removed from your lungs, it is certainly better that we are using E10, and it would be better yet if we could go to E20.
1.4. Ethanol Blend Emissions from individual vehicles
This result form the Knoll et al 2009 experiments shows further good news for formaldehyde and ethanol emissions. First the formaldehyde emitted at E20 drops down to the reference level of E0 values for some vehicles. We don't know why, but if this is accurate, it is exciting news. Second, the ethanol emissions at E15 and E20 drop down significantly from their E10 levels.
Looking at just the formaldehyde changes as we go from E0-E20, Knoll et al 2009, we see (below) that of the 10 vehicles formaldehyde tests shown:
1. E15 formaldehyde emissions are less than or equal to the E0 value for 2007 Accord, 2003 Taurus, 2007 Ford F150, 2007 Chrysler town and country, 2003 Camry, 2007 Camry and the 2003 Altima.
2. E20 formaldehyde emissions are less than or equal to the E10 level for 2007 Accord, 2003 Ford Taurus, 2007 Chrysler ..., 2007 Buick Lucerne, 1999 Ford Crown Victoria, 2001 Chrysler PT Cruiser, 2003 Camry, 2007 Camry and the 2003 Altima.
3. E20 formaldehyde emissions are less than E0 for the 2007 Accord, 2003 Ford Taurus, 2007 Buick Lucerne, 2003 Camry, 2007 Camry and the 2003 Altima.
4. E10 has lower the formaldehyde than the E0 baseline for the two Camry's and the 2003 Altima.
Note: all vertical scales are the same. the divisions are 0.25 mg/mile. It is clear that E15 and E20 for 4 of the 10 vehicles is less than half of the E0 of the other 6.
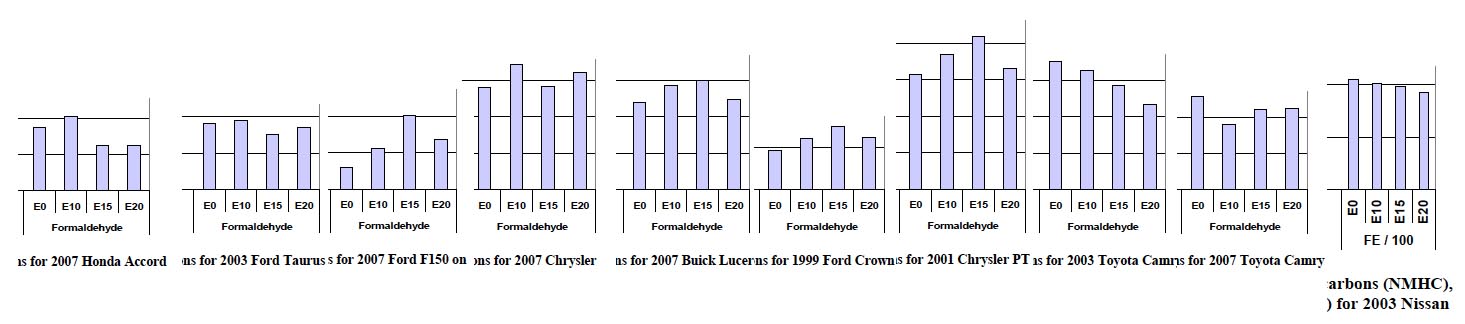
This is a remarkable result. It takes away the notion that ethanol, because it is an alcohol, will produce an unacceptable level of formaldehyde -- since the formaldehyde emissions from as much as 20% ethanol can be lower than the formaldehyde emissions from pure gasoline.
.