Global Warming
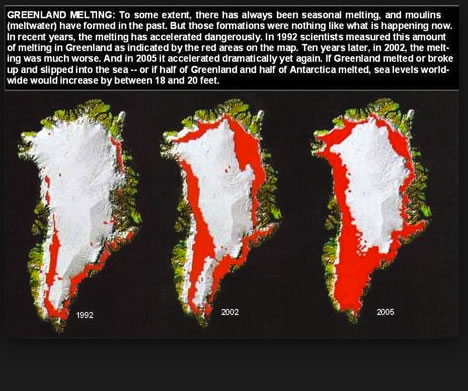
The time lapsed satellite images of Greenland's ice cap melting sets the tone of this section. We first discuss good and bad interpretations of data, and then look at causes and some effects, explaining the images of Greenland shown here and featured below.
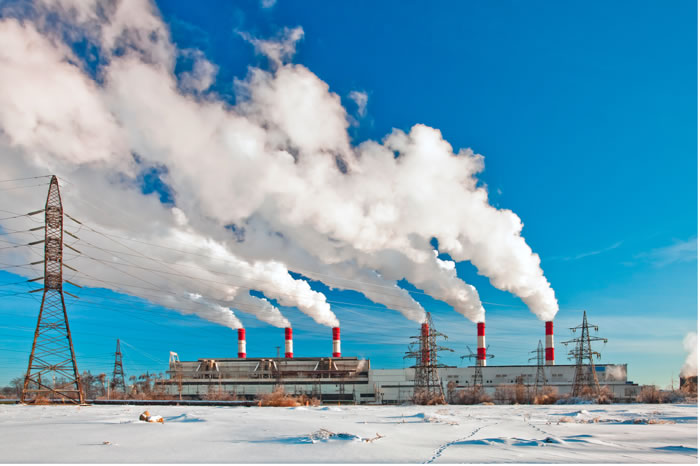
The gases rising from our powerplants and factories, primarily the gas CO2, is the primnary cause of this rapid warming.
1. Introduction
1.1 Understanding how to interpret data.
Is Global warming real? The two biggest problems with getting at the truth are incorrect analysis of the data and suggestions that the fact are fixed. Lets look at misinterpretation issues first, then the business of seeding doubt.
O
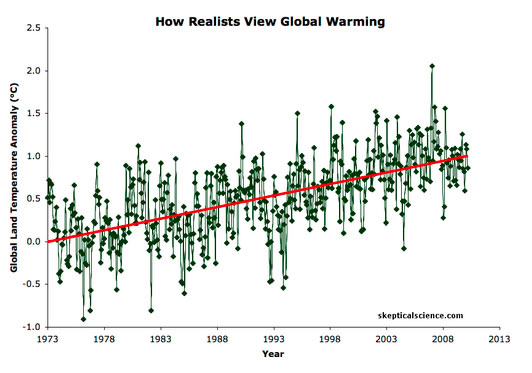
As the video shows, it is the trend line that counts in terms of knowing where we are going over the next generations. The Global Land Temperature Changes are shown below from 1973-2010. It is clear that the trend (the climate -- the dog owner) is up. However, if one wants to twist the same data to say that the temperatures are falling, they can follow the "dog" when it goes 'south" by picking the selected short periods and highlight these excursions.
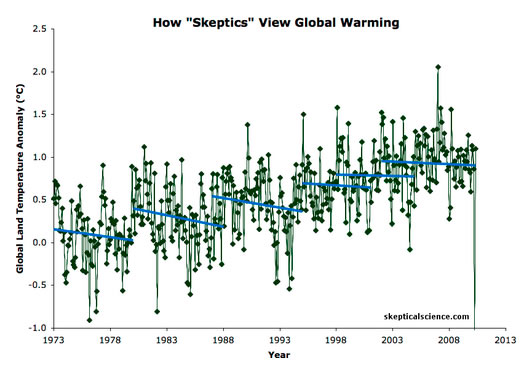
Which approach do you want to follow?
1.2. How we can be mislead by other interests
Well, now lets see how your thoughts can be managed by others that have no interest in your welfare.
1.3. Well, what are the causes?
Several gases are responsible, but the biggest contributors are CO2 (carbon dioxide) and CH4 (methane -- essentially natural gas) Their increase is essentially out of control. The CO2 emissions per persons is clearly related to the income of that person. The chart below shows that persons living in the western hemisphere emit up to twenty times more CO2 than persons living in Africa.
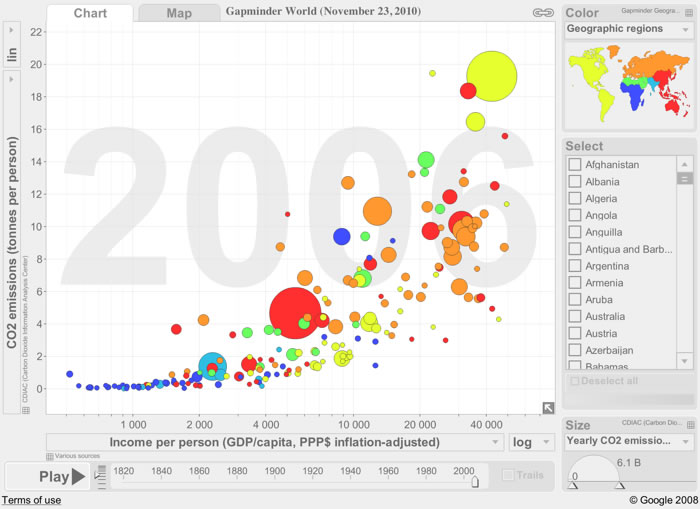
It is clear that as more people move from agrarian economies to urban lifestyles the amount of CO2 in the atmosphere is going to increase.
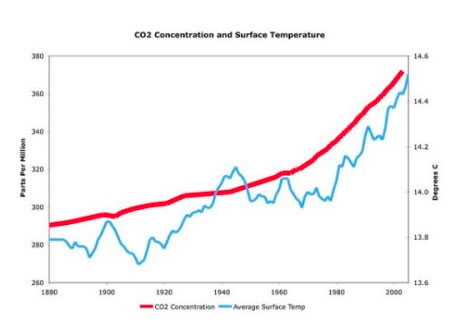
The rise in the earths temperature and the increase in CO2 are shown on the graph below. The correlation is very clear. Read more at http://planetsave.com/2009/06/07/global-warming-effects-and-causes-a-top-10-list/#xGZvvrIgwgSlXi1R.99
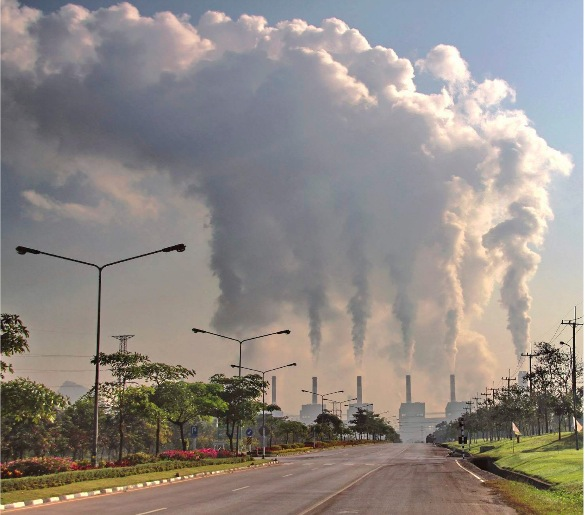
The largest contributor to CO2 are power plants.
The photo above shows emissions from a power plant, we see the particulates and steam, but the CO2 is invisibly mixed in these plumes.
The second largest contributor is automobile exhausts.
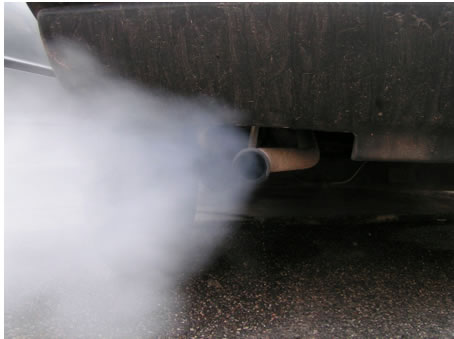
Our modern car culture and appetite for globally sourced goods is responsible for about 33% of emissions in the U.S. With the world's population growing at an alarming rate, the demand for more cars and consumer goods means that we are increasing the use of fossil fuels for transportation and manufacturing. Our consumption is outpacing our discoveries of ways to mitigate the effects, and there is no end in sight to our massive consumer culture. With the developing world's population moving into the middle class, the CO2 emissions rate is going to increase.
The third largest contributor is livestock, particularly beef cattle.
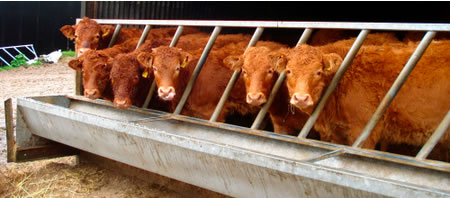
Methane is another extremely potent greenhouse gas, ranking right behind CO2. When organic matter is broken down by bacteria under oxygen-starved conditions (anaerobic decomposition) as in rice paddies, methane is produced. The process also takes place in the intestines of herbivorous animals, and with the increase in the amount of concentrated livestock production, the levels of methane released into the atmosphere is increasing.
The fourth is deforestation, especially tropical forests.
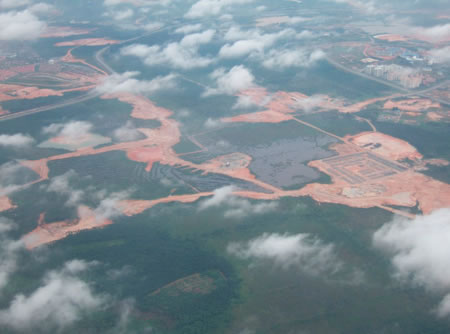
The use of forests for fuel (both wood and for charcoal) is one cause of deforestation, but in the first world, our appetite for wood and paper products, our consumption of livestock grazed on former forest land, and the use of tropical forest lands for commodities like palm oil plantations contributes to the mass deforestation of our world. Forests remove and store carbon dioxide from the atmosphere, and this deforestation releases large amounts of carbon, as well as reducing the amount of carbon capture on the planet.
The 5th is chemical fertilizers on croplands
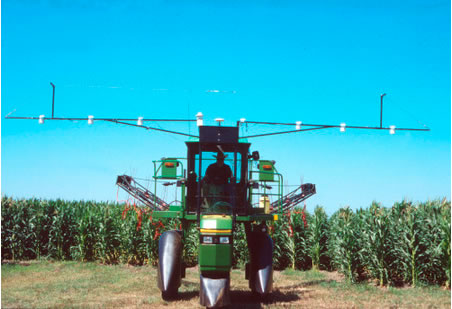
In the last half of the 20th century, the use of chemical fertilizers (as opposed to the historical use of animal manure) has risen dramatically. The high rate of application of nitrogen-rich fertilizers has effects on the heat storage of cropland (nitrogen oxides have 300 times more heat-trapping capacity per unit of volume than carbon dioxide) and the run-off of excess fertilizers creates ‘dead-zones’ in our oceans. In addition to these effects, high nitrate levels in groundwater due to over-fertilization are cause for concern for human health.
1.4. Landmass Changes
The ice is melting so fast in Greenland that the giant island is rising noticeably as the weight is lifted. In some spots, the land is rising 1 inch per year. A vast ice cap covers much of Greenland, in some places up to 1.2 miles (2 km) thick. The ice, in place for eons, presses down the land, making the elevation at any given point lower than it would be sans ice. Scientists have documented on Greenland and elsewhere that when longstanding ice melts away, the land rebounds. Even the European Alps are rising as glaciers melt.
If all of Greenland's ice were to melt, perhaps as quickly as in a few centuries, seas would rise 21 feet (6.5 meters) all around the planet, according to the U.S. Geological Survey. And already, an alarming melt is under way there, other studies find. In 2007, the ice melted at a rate of 150 percent of the average going back to 1988. Recent studies have found that as the ice melts more rapidly, water pours through fissures and gets under glaciers, acting like a lubricant to allow the ice to race ever-faster toward the sea. In addition, when snow melts at high altitudes and then refreezes, it can absorb up to four times more sunlight, creating even more melting the next year. Some scientists fear a snowball effect could exacerbate the ice sheet's disintegration in as little time as a matter of decades. But given a lack of understanding about the mechanisms, and questions about how warm the planet will get and how much ice will melt, scientists' estimates for the extent of sea-level rise by the end of this century range from just inches to perhaps 6 feet or so.
Satellites have given us a accurate and eye opening record of Greenland's icecap changes due to global warming.

The most recent research using data from 1996 to 2005 shows that the ice sheet is thinning even faster than supposed by IPCC. According to the study, in 1996 Greenland was losing about 96 km3 or 23.0 cu mi per year in mass from its ice sheet. In 2005, this had increased to about 220 km3 or 52.8 cu mi a year due to rapid thinning near its coasts, while in 2006 it was estimated at 239 km3 (57.3 cu mi) per year. It was estimated that in the year 2007 Greenland ice sheet melting was higher than ever, 592 km3 (142.0 cu mi). Also snowfall was unusually low, which led to unprecedented negative −65 km3 (−15.6 cu mi) Surface Mass Balance. If iceberg calving has happened as an average, Greenland lost 294 Gt of its mass during 2007 (one km3 of ice weighs about 0.9 Gt).According to the 2007 report from the IPCC, most results indicate accelerating mass loss from Greenland during the 1990s up to 2005. Assessment of the data and techniques suggests a mass balance for the Greenland Ice Sheet ranging between growth of 25 Gt/yr and loss of 60 Gt/yr for 1961 to 2003, loss of 50 to 100 Gt/yr for 1993 to 2003 and loss at even higher rates between 2003 and 2005. Analysis of gravity data from GRACE satellites indicates that the Greenland ice sheet lost approximately 2900 Gt (0.1% of its total mass) between March 2002 and September 2012. The mean mass loss rate for 2008-2012 was 367 Gt/year. A paper on Greenland's temperature record shows that the warmest year on record was 1941 while the warmest decades were the 1930s and 1940s. The data used was from stations on the south and west coasts, most of which did not operate continuously the entire study period. While Arctic temperatures have generally increased, there is some discussion over the temperatures over Greenland. First of all, Arctic temperatures are highly variable, making it difficult to discern clear trends at a local level. Also, until recently, an area in the North Atlantic including southern Greenland was one of the only areas in the World showing cooling rather than warming in recent decades, but this cooling has now been replaced by strong warming in the period 1979–2005.
.


